Catió elevation
Catió (Tombali), Guinea-Bissau elevation is 15 meters and Catió elevation in feet is 49 ft above sea level [src 1]. Catió is a seat of a first-order administrative division (feature code) with elevation that is 12 meters (39 ft) smaller than average city elevation in Guinea-Bissau.
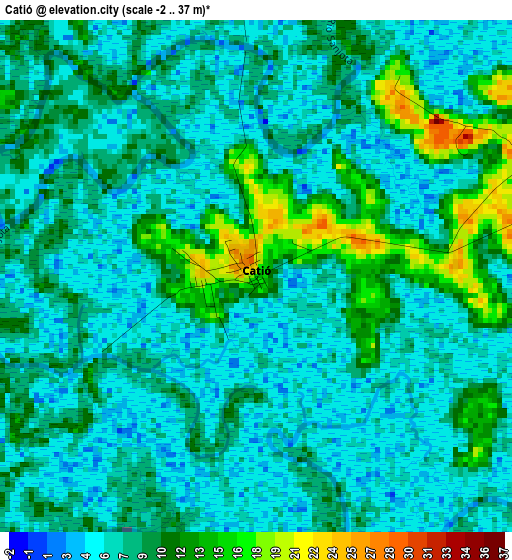
Below is the Elevation map of Catió, which displays elevation range with different colors. Scale of the first map is from -2 to 37 m (-7 to 121 ft) with average elevation of 7.9 meters (=26 ft) [note 1]
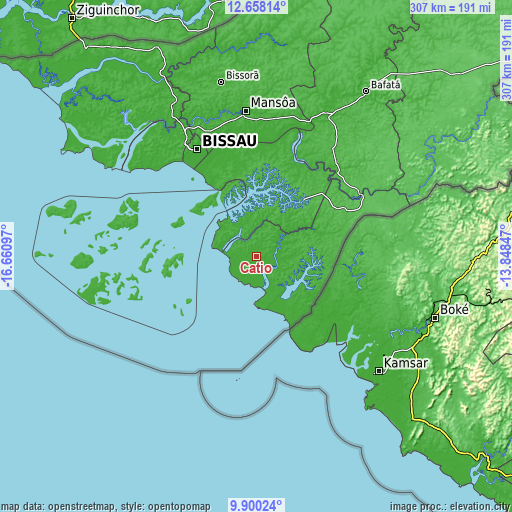
These maps also provides idea of topography and contour of this city, they are displayed at different zoom levels. More info about maps, scale and edge coordinates you can find below images.
| \ | Map #1 | Map #2 | Topo.Map |
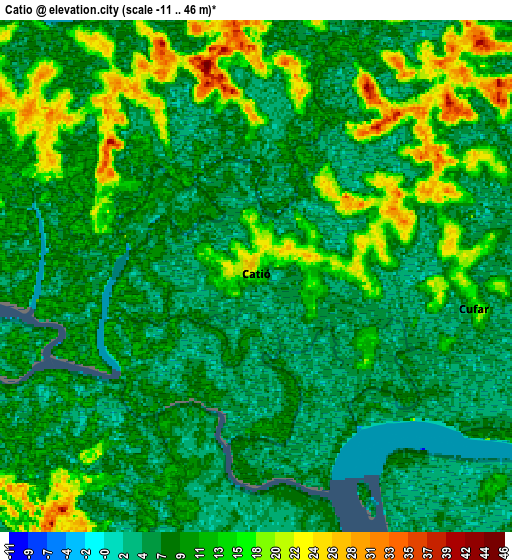
| Scale [m] | -2..37 m | -11..46 m | × |
| Scale [ft] | -7..121 ft | -36..151 ft | × |
| Average | 7.9 m = 26 ft | 9.7 m = 32 ft | × |
| Width | 9.58 km = 6 mi | 19.17 km = 11.9 mi | 306.6 km = 190.5 mi |
| Height | 9.58 km = 6 mi | 19.17 km = 11.9 mi | 306.7 km = 190.6 mi |
| ↑Max Latitude | 11.325593° | 11.368679° | 12.65814° |
| Latitude at center | 11.2825° | 11.2825° | 11.2825° |
| ↓Min Latitude | 11.239401° | 11.196295° | 9.90024° |
| ← Min Longitude | -15.298665° | -15.342611° | -16.66097° |
| Longitude center | -15.25472° | -15.25472° | -15.25472° |
| →Max Longitude | -15.210775° | -15.166829° | -13.84847° |
Nearby cities:
Cities around Catió sort by population:
• Bissau elevation 13 m
74.6 km,  329°
329°
• Bafatá 20 m
117.5 km,  33°
33°
• Bissorã 26 m
106.7 km,  348°
348°
• Bolama 25 m
40.7 km,  323°
323°
• Bubaque 26 m
63.1 km,  270°
270°
• Mansôa 14 m
88.2 km,  355°
355°
• Buba 20 m
44.2 km,  39°
39°
• Quebo 22 m
35.5 km,  80°
80°
• Canchungo 21 m
121.7 km, 315°
• Farim 8 m
133.6 km,  1°
1°
• Quinhámel 21 m
93.8 km, 315°
• Fulacunda 43 m
55.7 km,  9°
9°
Multilingual:
 En español:
Catió elevación 15 m.
 En France:
Catió élévation 15 m.


Sources and notes:
- [note 1] Map square and city borders are not equal. Map elevation data is calculated only from area inside that square.
- [src 1] Elevation data from geonames database provided with same terms of usage.
- [src 2] The elevation map of Catió is generated using elevation data from NASA's 3 arcsec (90m) resolution SRTM data.
- [src 3] Base (background) map © OpenStreetMap contributors tiles are generated by Geofabrik and OpenTopoMap.
Copyright & License:
This Catió Elevation Map is licensed under CC BY-SA. You may reuse any part from this page, if you give a proper credit by linking to this URL:
 More info on terms of use page.